NASDAQ $0.00   TSX $0.00

Search
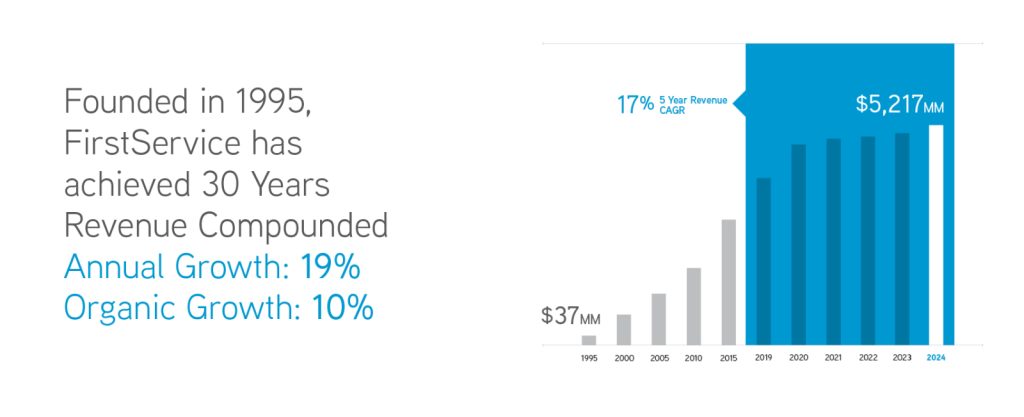
Consistent achievement of internal growth targets

The recurring revenue model provides top-line predictability.
Growth Charts

Revenues (US$ Millions)
2018
$1,931
2019
$2,407
2020
$2,772
2021
$3,249
2022
$3,746
2023
$4,335
Adjusted EBITDA (US$ millions) 1
2018
$191
2019
$235
2020
$284
2021
$327
2022
$352
2023
$416
Adjusted EPS (US$) 1
2018
$2.61
2019
$3.00
2020
$3.46
2021
$4.57
2022
$4.24
2023
$4.66
Annual Reports

Our discipline and proven business model has led to more than three decades of consistent growth and solid shareholder returns.

Careers

Our companies strive to foster a strong culture that embraces diversity and inclusion, attracts those who share our values and offers opportunities for professional development and growth.

Presentations

Learn what makes FirstService a leader in outsourced essential property services and our companies’ employers of choice in their respective industries.

Note:

  1. Adjusted EBITDA and Adjusted EPS as presented above are non-GAAP measures. Investors should consider non-GAAP measures in addition to, not as a substitute for, the comparable GAAP measures. Please visit www.sedarplus.ca to view our annual and interim MD&As, under Reconciliation of non-GAAP financial measures, for each of the above mentioned periods for a description of each non-GAAP measure as well as the reconciliations to GAAP measures.